Industrial heat recovery installation
APPROACH · Capture → Store → Reuse → Convert

We don't ask you
to accept a claim.

We ask you to let us measure the waste, map the heat and water flows, protect the original technology, and show you the first bankable pilot. Everything else follows from metered data.

The process

Four moves, in order.

Each stage does one job, and each stage is only added where the site's chemistry, temperature and flow actually support it.

01

RPC captures the solids

Particulate is pulled out of coal, biomass, wood, waste and fuel-oil exhaust streams before any broader heat-recovery integration — so nothing downstream fouls.

Client value

A cleaner path for solid-fuel operations, reduced visible particulate burden, and stronger control over the whole platform.

02

SRU condenses the exhaust

The flue-gas condensing economizer recovers sensible and latent heat and, where chemistry permits, water vapour for greenhouse, condensation, compression or process use.

Client value

Lower stack losses, fuel reduction, possible water recovery, reduced stack noise, and productive use of CO₂ and H₂O where appropriate.

03

TESS strips the Btus

Novacab TESS pulls thermal energy from hot water, vapour, condenser loops, stack heat, compressor and refrigeration rejection, and process streams.

Client value

Less waste heat, a balanced thermal profile, lower cooling burden, reduced water pressure, and more usable heat per unit of fuel.

04

SPCM buffers and releases

Synthetic phase change material banks the energy and releases it later — smoothing peak loads, thermal cycling, vacuum and load swings, and temperature-sensitive processes.

Client value

Improved product consistency, less rework and spoilage, less manual intervention, and better uptime.

05

Convert what qualifies

Where temperature and flow support it, TESS enables behind-the-meter power generation from rejected thermal energy above roughly 53–55 °C.

Client value

Additional output, resilience, emergency and black-start support for key infrastructure, and lower grid exposure.

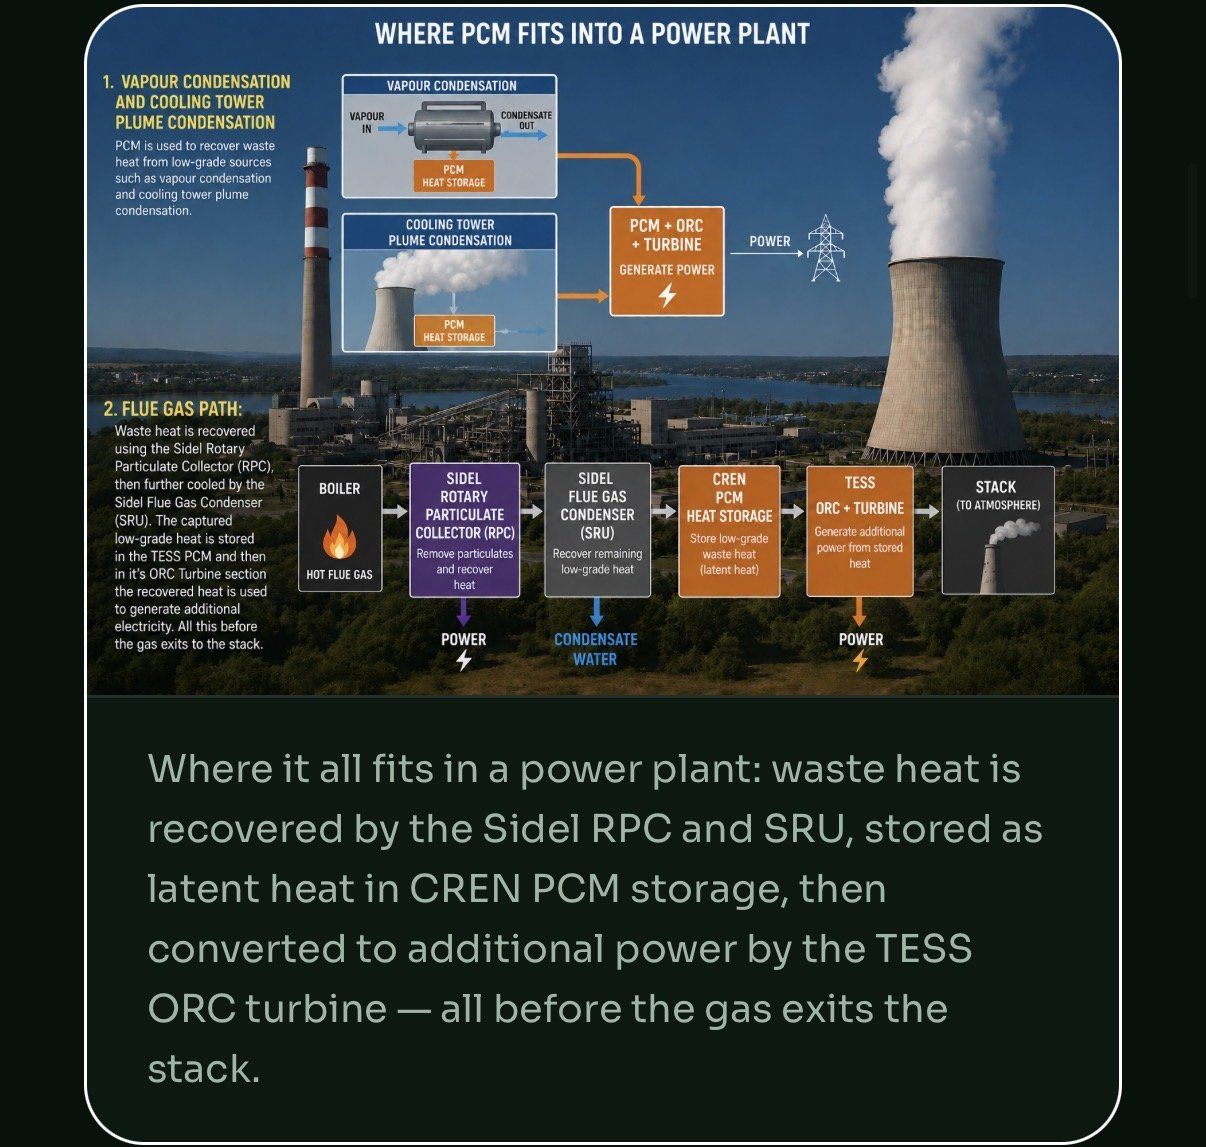
Where the platform fits in a plant: boiler, Sidel RPC, Sidel SRU, PCM heat storage, TESS ORC turbine, clean stack
Where it all fits: waste heat is recovered by the Sidel RPC and SRU, stored as latent heat in PCM storage, then converted to additional power by the TESS ORC turbine — all before the gas exits the stack.
Materials & technology integrity

What's actually inside.

🧪

SPCM

TESS is built around synthetic phase change materials designed to be non-toxic, non-carcinogenic, non-flammable and environmentally benign — and to perform reliably for decades.

💨

SRU

A practical heat-exchanger and flue-gas condensing platform for combustion exhaust streams where chemistry, condensation, corrosion and condensate treatment have been reviewed.

🌀

RPC

An authorised particulate-management pathway for solid-fuel and particulate-heavy exhaust. Unauthorised copies cannot deliver the IP-safe engineering stack or warranty accountability.

Project discipline

Pilot first.
Always.

The safest commercial approach is not to promise a full-plant result from a paper estimate. It is to select a small, measurable pilot at the largest thermal pain point, make it bypassable, install around a planned shutdown, and measure savings before scaling.

PhasePurposeHow we control the time penaltyDeliverable
Data packageObtain fuel, power, water, steam, stack, refrigeration, cooling-tower, production, product-quality, maintenance and emissions data.Remote review first; a site visit only once the data is sufficient.Data request and gap list.
Thermal mapMap heat sources and heat sinks; identify clean, hot, continuous, nearby streams with strong reuse potential.No production disruption — operating logs and non-invasive measurement wherever possible.Heat and water balance.
Pilot scopePick one pilot with fast payback and low process risk.Modular, bypassable design; tie-ins planned for a maintenance window.Pilot engineering package and a conservative cost-benefit analysis.
M&V periodMeasure 30–90 days of savings in energy, water, product quality, emissions and uptime.Run in parallel with existing systems; redundancy is never removed prematurely.Measured savings report.
Full rolloutScale only once bankable data supports financing and management approval.Staged by area, boiler, pan, line, cooling system or furnace.Full EPC quote, finance plan and implementation schedule.
Commercial sequence

Metered baseline → limited pilot → bankable savings → financed rollout → local assembly and manufacturing as volume justifies. Every client-facing cost-benefit analysis uses pilot-first economics, not full-plant paper estimates.

India — finance & incentives

Incentives are upside.
Never the base case.

Eligibility depends on sector, project scope, company size, state, technology classification, commissioning timing, lender participation and documentary compliance. Every pathway below must be verified by the India finance and legal team before any client commitment.

PathwayPotential relevanceVerification required
BEE / ADEETIEEnergy-efficient technology deployment support for eligible industrial and MSME clusters — handholding, Investment Grade Energy Audits, Detailed Project Reports, M&V and interest-subvention pathways.Sector and cluster eligibility, borrower category, lender participation, technology qualification, and the timing and amount of support.
PAT / ESCertsLarge designated consumers should screen whether measured energy savings carry compliance or certificate value.Designated-consumer status, baseline, admissibility, and current certificate market rules.
MNRE biomass / bioenergy / waste-to-energySugar mills, biomass, CBG, waste-to-energy and non-bagasse cogeneration projects may have support pathways depending on exact scope.Current programme status, eligible technology, commissioning window, CFA rules, and exclusion or overlap with other subsidies.
State industrial programmesStates may offer energy-efficiency, pollution-control, water-saving, manufacturing, captive-power or capital subsidy support.The state policy current to the project location, and whether imported versus local-assembly content affects eligibility.
Green / ESG financeBanks, development lenders, customers, corporates and investors may support lower-carbon, water-saving, resilient industrial projects.Measurement protocol, borrower credit, lien and security, offtake or shared-savings structure, and guarantee requirements.
India — the national opportunity

A back-of-envelope look
at the scale.

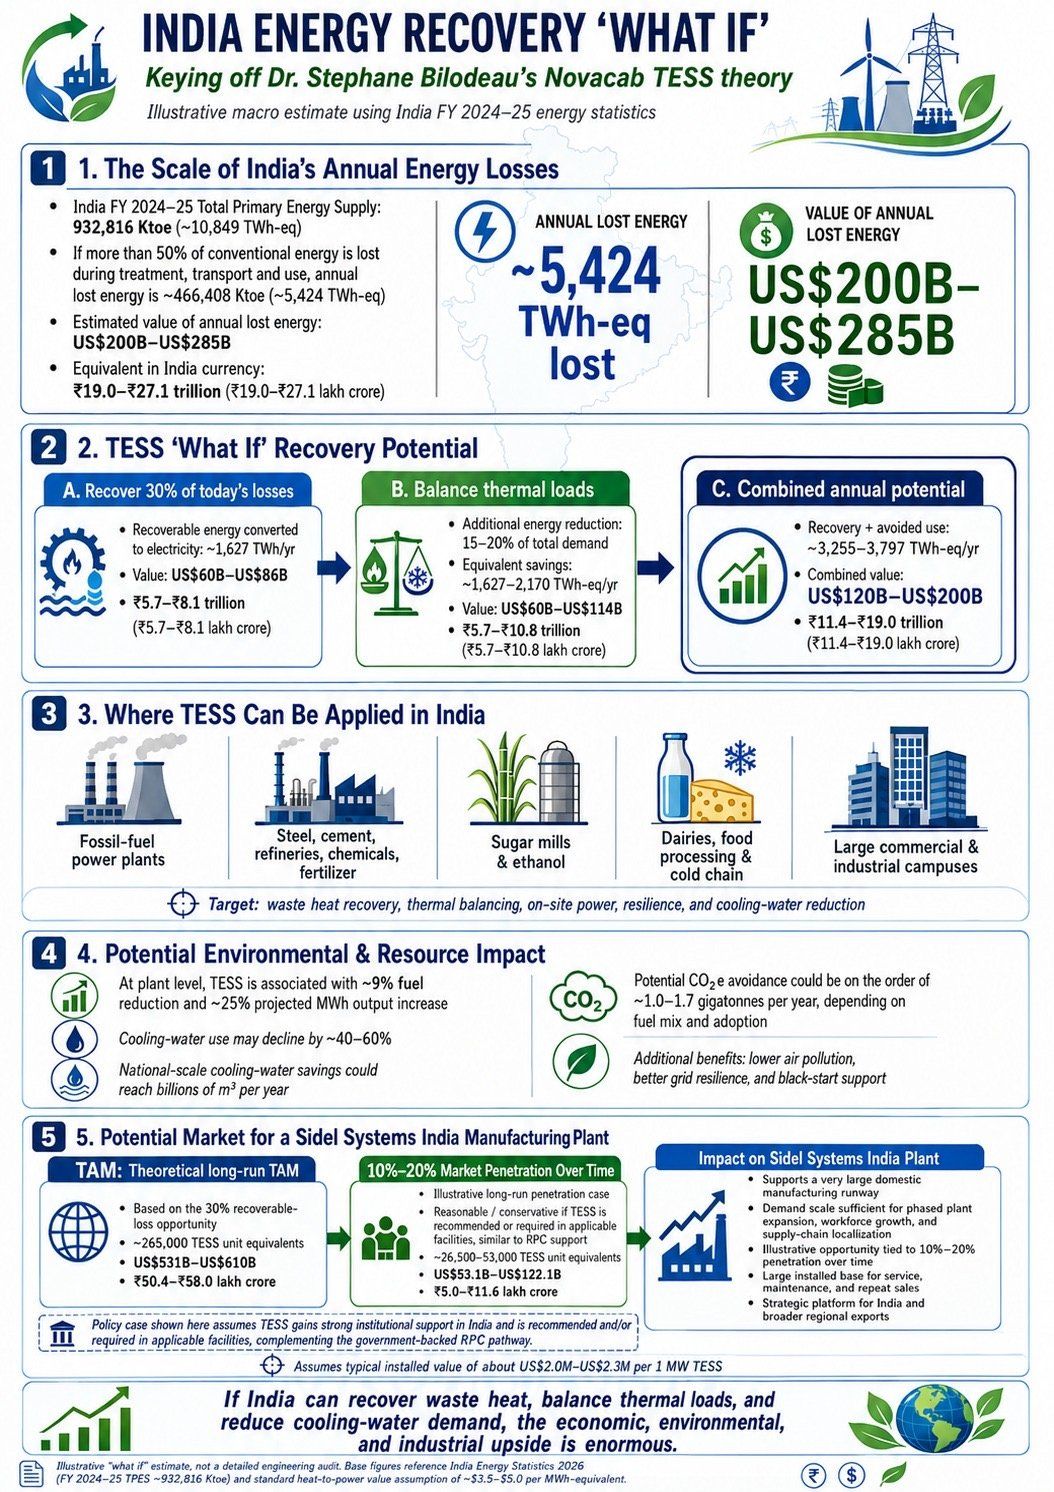
Keying off Dr. Stephane Bilodeau's Novacab TESS theory, this is an illustrative "what if" model against India's FY2024–25 energy statistics — a macro estimate to size the conversation, not a detailed engineering audit. Every figure here is a planning-level guesstimate, not an audited or contracted number.

Illustrative figureWhat if the model assumesWhat it's meant to show
~5,400 TWh-eq/yr lost (~$200B–$285B)If more than half of India's conventional energy supply is lost during treatment, transport and use, applied to FY2024–25 primary energy supply.The order of magnitude of the national waste-heat problem, not a measured figure.
~1,600–3,800 TWh-eq/yr recoverable (~$120B–$200B)TESS recovering roughly 30% of today's modeled losses, plus 15–20% further reduction from thermal-load balancing.A ceiling for what waste-heat recovery could plausibly reach at national scale — before any real project pipeline exists.
$53B–$122B addressable at 10–20% penetrationAgainst a theoretical long-run TAM of $531B–$610B for a Sidel Systems India manufacturing plant, phased in over time.A directional case for why local manufacturing and assembly could make sense — not a sales forecast.
India Energy Recovery What If infographic: illustrative macro estimate of India's annual lost energy, TESS recovery potential, industries where TESS could apply, and potential market for a Sidel Systems India manufacturing plant, based on FY2024-25 India energy statistics
The full illustrative model: scale of India's annual energy losses, TESS "what if" recovery potential, target industries, and the theoretical Sidel Systems India manufacturing opportunity.

TESS + ORC waste heat recovery vs. the nuclear route

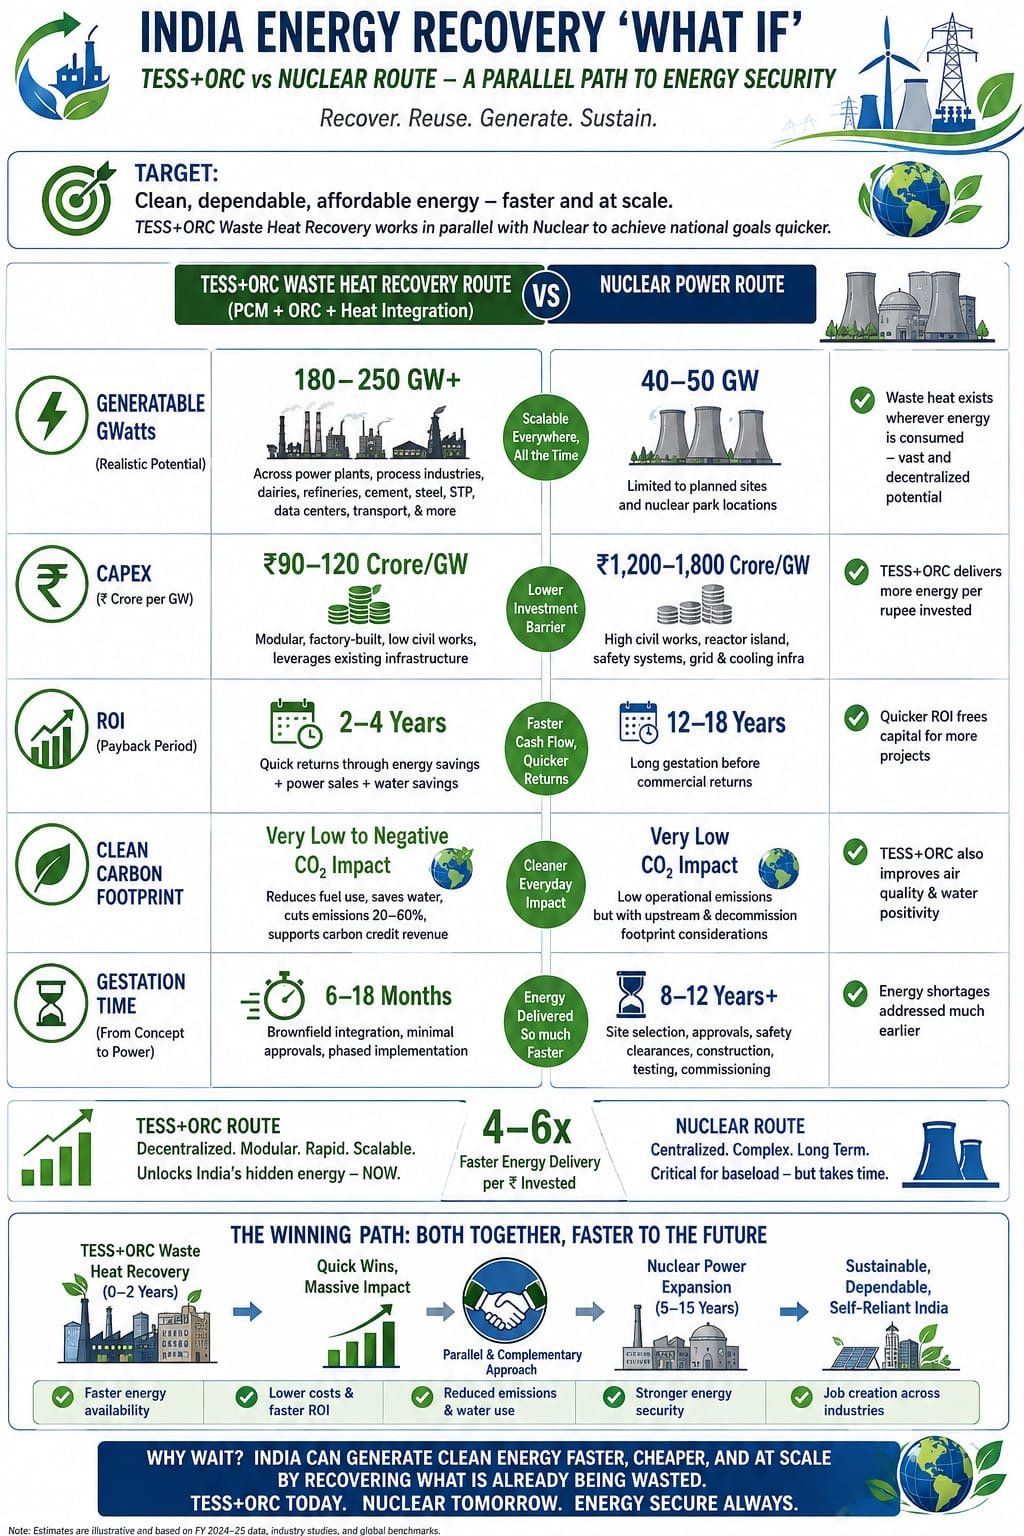
The same "what if" model compared against India's nuclear buildout — framed as complementary paths, not competing ones. Waste heat recovery can start now, in parallel, while longer-lead nuclear capacity comes online.

Comparison pointTESS + ORC waste heat recoveryNuclear power
Illustrative realistic potential180–250 GW+, distributed across plants, industry and data centers40–50 GW, concentrated at planned sites
Illustrative capex₹90–120 crore/GW — modular, factory-built₹1,200–1,800 crore/GW — reactor island, safety systems
Illustrative payback2–4 years12–18 years
Illustrative time to power6–18 months, brownfield integration8–12+ years, siting through commissioning
India Energy Recovery What If infographic comparing the TESS+ORC waste heat recovery route to the nuclear power route: generatable gigawatts, capex per gigawatt, ROI payback period, carbon footprint and gestation time from concept to power
TESS+ORC and nuclear as parallel, complementary paths — waste heat recovery delivering energy faster while longer-lead nuclear capacity comes online.
These are guesstimates, not claims

Every number on this page and the one above is a macro, illustrative "what if" estimate built on published national energy statistics, industry benchmarks and reference-plant analogues — not a site-specific measurement, an audited figure or a forecast anyone should finance against. They exist to size the conversation and are superseded, on any real project, by the metered baseline and engineering process described above.

Subalpine forest overlooking a glacial lake and mountains
Collective impact

The value isn't one project.
It's the replication.

Every one of these industries shares the same problem: paid-for energy is generated, then rejected. National impact grows when the first pilots prove fuel savings, water savings, output gains and lower emissions intensity in a form that can be financed and repeated — with local engineering, local assembly and local service behind it.

Validation boundary

All claims relating to site savings, water reduction, output increase, emissions outcomes, payback, incentives and deployment economics are planning assumptions, analogues or prior-project references — unless and until they are validated for the specific facility through engineering, measurement, vendor quotation, financing documentation, legal review and final commercial agreements. Near-zero emissions is an engineered project objective, not a regulatory guarantee, until it is demonstrated.

← Where it appliesIndustries We Serve